Cane Toad Invasion
Information about cane toads in Australia
Investigation
Using the data set & map, where has the cane toad lived over time? How did it spread?
Prediction
What will happen in the next 5 years? How will this impact the biodiversity of the area?
Figures
There are three figures using information from GBIF.
The first is an animated map showing spread of toads over time.
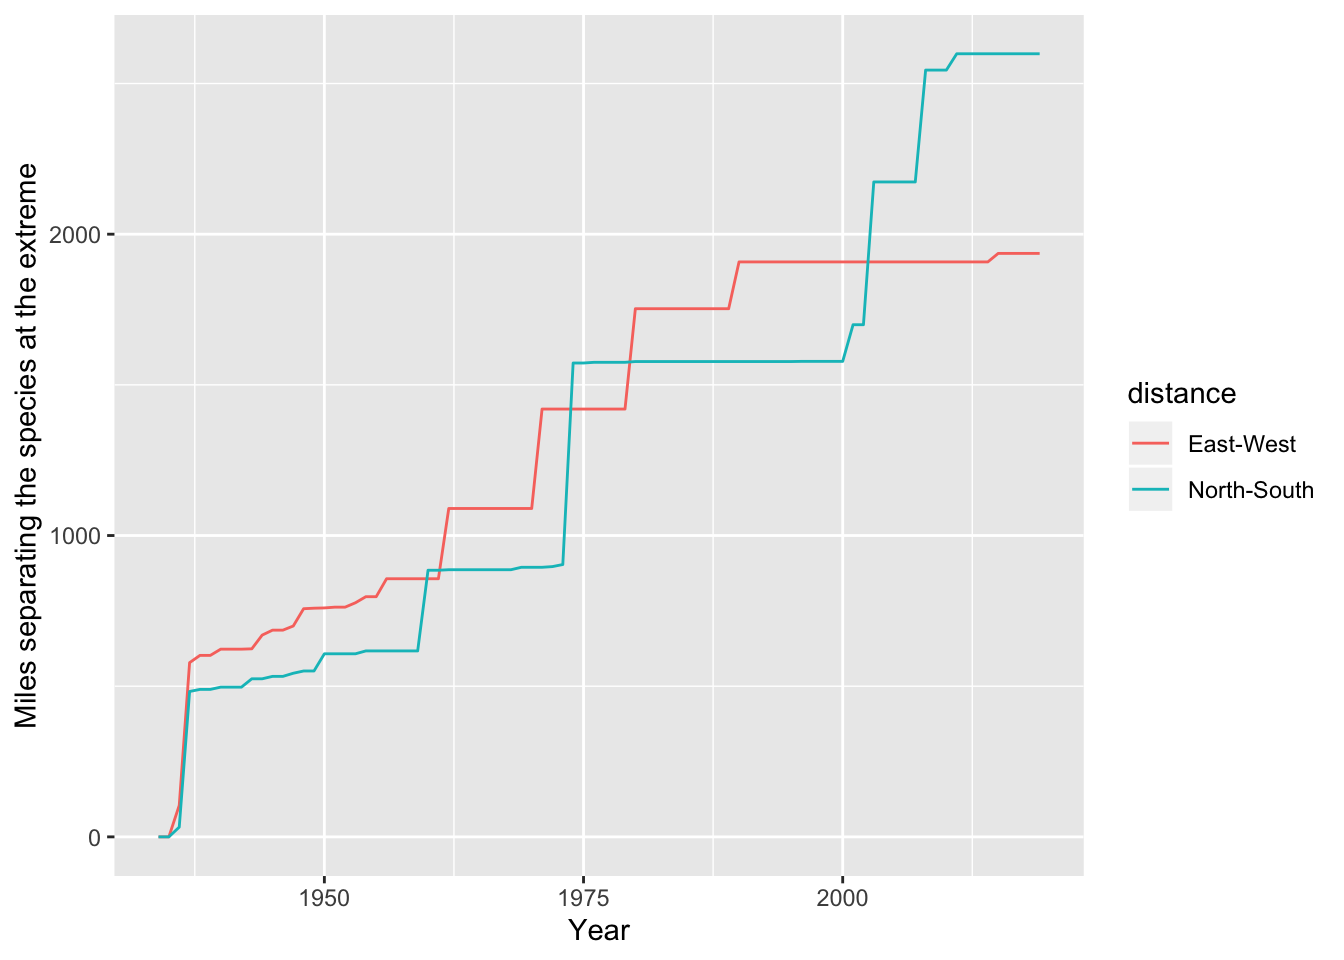
This shows growth of the extent of land occupied: the maximum distance in miles from records at the extreme of the range.
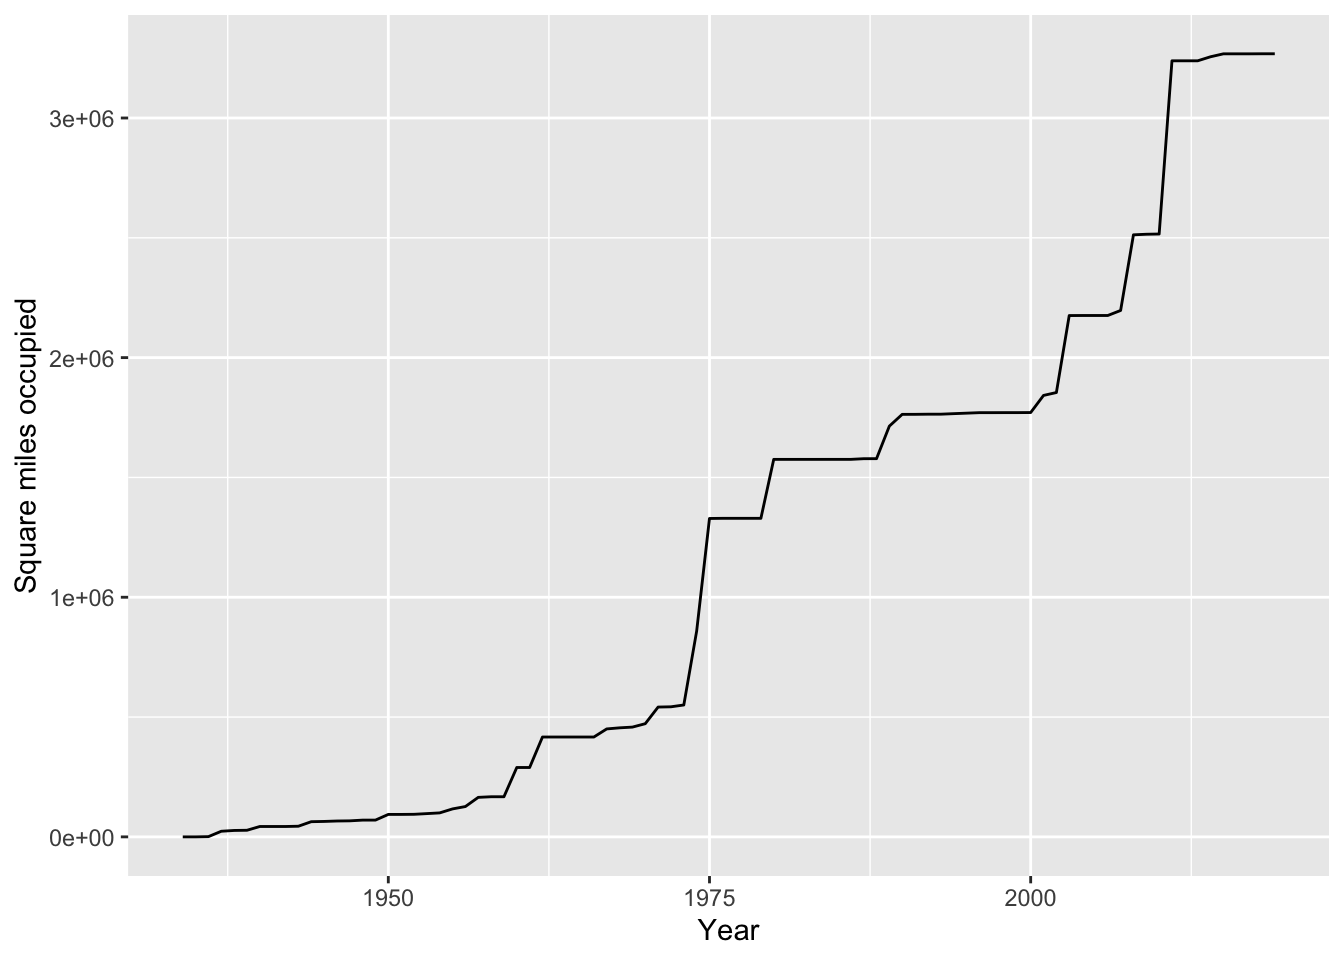
This shows growth of the area occupied over time: square miles versus time. Note that this is done by drawing a polygon around all the included points, but there may be areas of the enclosed range that actually do not have cane toads (so this may be an overestimate).
You can download the estimates of the spread of the species over time as AustraliaExtents.csv.